INTRODUCTION
Statistical Package for Social Sciences (SPSS) is one of the most
popular data analyses software packages used by academics. It use cuts across
all social sciences based disciplines hence, it important for all researchers
to understand how to use this great tool. SPSS is used for the analyses data
employing statistical methods like:
1) Simple and Multiple Regression Analyses; 2) Correlation Analyses;
(Part, Partial, Bi-variate, Multivariate etc); 3) Analyses of Variance; 4) Analyses of Co-Variance; 5) Neural Networks; and so many others we may
not be able to detail here.
This article is designed to show you how to use this great statistical
package to perform Simple Regression Analyses and Multiple Regression Analyses.
Finally, the article will show you how to interpret your results.
What is Regression?
Regression is a simple but powerful Statistical tool used for predicting or forecasting outcomes
and understanding the relationships between variables of a study.
The first step in performing an analyses be it regression or
correlation analysis is to open the software user interface. We assume of
course that you have and understand the basics of your data-set. For example,
we assume that you understand the difference between dependent and independent
variables and have also been able to identify this in your data set. When you
open the user interface of SPSS from its icon on your computer, you should see
a screen like the one below:
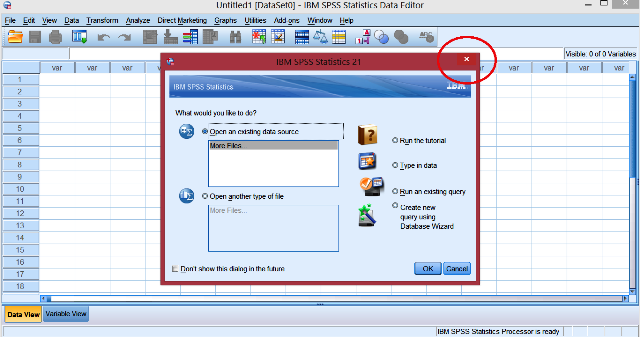
This is the first screen that you see when you open the software every
time you want to use it. What you should do is to close the smaller inset
window from the button indicated by the red circle. From the window now
remaining you can now start your analysis.
SIMPLE REGRESSION
Simple
regression involves only two variables, the dependent and independent variables
Running Your Analysis

If you already have your data in another spreadsheet program like MS
Excel just copy and paste your data. When you are done entering your data,
click on the variable view close to the circled data view at the bottom left of
the screen. This will give the window below:

The first column captioned ‘Name’,
is by default filled in the first two rows with VAR00001 and VAR00002 given the
number of variables. VAR00001 is your dependent variable and VAR00002 is your
independent variable. Please rename as appropriate. For clarity sake, we give
them the hypothetical names GDP and FDI.
Please note that spaces are not allowed in renaming any of the
variables.
When you are done with the renaming, please go back to the data view
and observe that the columns with data has been re-captioned GDP and FDI from
VAR00001 and VAR0002 like it is shown below:

Now you are ready to perform the actual analyses and as the name
implies, find the tab at the top named:
Analyze and click on it as shown below:

When you
click on the highlighted 'linear' tab, the screen below will appear:

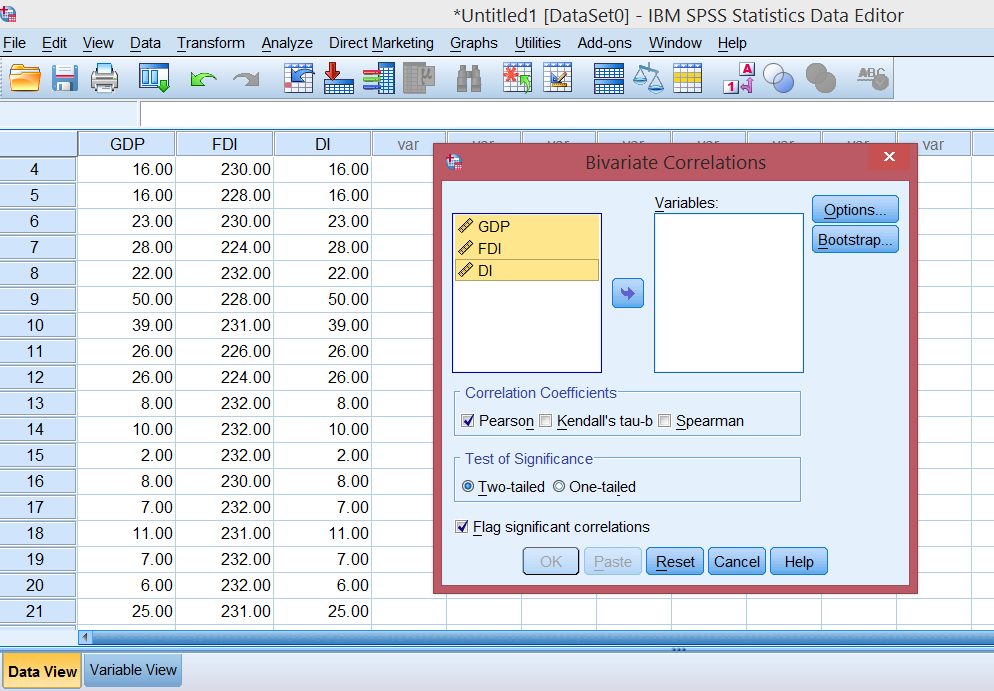
From the
window that is shown, highlight GDP and drag to the box captioned 'Dependent'.
Also highlight FDI and drag to the box marked 'independent'.
Now click on statistics in the same box, do you see any additional
features you want with your output?
If yes select it and proceed to 'options'
and select any appropriate options for you study. But it is advised that you
stick to the basic analysis in this first try.

When you are
done, now click on ‘OK’ at the
bottom of the screen like so .....

Now you have performed your first regression data analyses using SPSS - CONGRATULATIONS!
Specimen Output
Here is a
specimen of the result output:

Please note that the output shown below was copied to MS word
document.
Here is how to copy your result to word.
From the output screen shown, click on 'Edit', Scroll down and click on ‘Select all’. Now the entire result output is selected, go back and
click on 'Edit' again but this time
select 'Copy', wait a moment, now
open a word document and paste your result. Now you have your entire result as
shown in the specimen result output above:
Interpreting Your Results
Observe that the specimen result shown above has two pages with
different headings and captions. Here we chose to display only those parts of
the results that are useful to interpret a simple regression result. These are
the tables marked ‘Model Summary’
and ‘Coefficients’. The ‘Anova’ Table is not useful here and
hence will not feature for our interpretation.
In the ‘model summary’ table,
the first column is marked model and obviously given that we are working with
simple regression, there is only one model.
The second
column is marked 'R'. The R means
co-efficient of correlation which measure the strength of the relationship
between the variable under study.
Thus, the Co-efficient of Correlation (R) value of .430 means that the
strength of the relationship between GDP and FDI is 43 percent.
Column number three is named 'R
Square' also called Co-efficient of Determination or (R2). The
value given under it measures the extent or degree to which changes in FDI can
be relied on to explain the changes in GDP.
The value of 'R Square, (R2) value of .185 means that changes or flow
of FDI can only explain 18.5 percent of the changes in GDP.
Now we move
on to the next relevant output table, the one marked Coefficients.
The first column i this table is also named 'Model' and even though
there appear to be 2 models in the column, only one (the second one) is recognized.
The first model named constant is not recognized because in theory, its
interpretation makes little practical sense. So, we concentrate on the second
named FDI.
The second column captioned Unstandardized Coefficients is further
subdivided into 'B' and 'standard error'. First, the caption 'Unstandardized
Coefficients' indicates that the results are displayed without any form of
modification. Hence, if you used data that is in the same level of measurement
this is the data point you should use for your interpretation
For example, if your data set for GDP and FDI are measured in absolute
Naira or Dollar values, then you will use this column. On the other hand, if
one data set is in Absolute Naira or Dollar values and the other is in ratio,
then your interpretation should be based on the next column named Standardized
Coefficients
the
Standardized Coefficients column is adjusted to take into consideration the
fact that the two data sets are measured at different scales.
Since both
of our data sets are in absolute values, we shall use the UnStandardized
Coefficients column for our interpretation.
The column
named 'B' means coefficient of regression. This looks at the specific relationship
between the variables of the study. Here, the value says -.095 which means that
the specific relationship between FDI and GDP is negative. Implying that a 1
percent increase in FDI will lead to a 0.095 percent decrease in GDP and vice
versa.
Remeber, if
the data sets were in different measurement scales, we will use the same
process of interpretation but based on the column captioned 'Standardized
Coefficients'.
Now we go to
the next column marked 't'. This simply means the T-test and is used for test
of hypothesis.
The process here is to compare the t-value as shown in the output to
the the critical t-statistic table and the same degrees of freedom (DF). If the
output t-value is greater than or equal (≥)
to the critical t-value, the null hypothesis is rejected if not, do not reject
the null hypothesis.
In this case, the output t-value is 1.784 (ignoring the sign) and the
critical t-value @ 14DF and 0.05 level of significance is 2.14. From the
above, we can see that the critical t-value is greater than the output value
hence, we do no reject the null hypothesis. The implication of this result is
that FDI does not 'significantly' affect GDP.
Running Your Analysis
Essentially, the steps involved in analyzing a simple regression data
are the same. The major difference is that instead of a single independent
variable in the box you have 2 or more independent variables.
Here we have added another data column named 'DI' following the same steps
used in simple regression above.

Specimen Output
Here is the specimen output for a multiple regression analysis
involving 2 independent variables

Now, repeat
the same steps we used interpreting the FDI variable in the simple regression
above for the 'DI' variable.
the major difference here is that in the case of the simple regression
analysis, the model summary was only summarizing for a single independent
variable but in this case, it is summarizing for 2 independent variables that
is: FDI and FI but the concept remains the same.
Thus, in this case, we say that the strength of the relationship
between FDI, DI and GDP is .434 (43.4 percent) and FDI and DI taking as a unit
can only account for 18.9 change in GDP.
Looking at the co-efficient table, we note that FDI has a negative
relationship with GDP as shown earlier but 'DI' has a positive effect of .051
0n GDP. This implies that for every unit increase DI, GDP is expected to also
increase at 0.051 units.
Again, we
compare our output t-value to the critical t-table and use the same critiria as
above to accept or reject the null hypothesis.
The last column named 'sig' can be used on a stand-alone basis to
accept or reject the hypothesis without recourse to the t-table. in this case,
.493 and .818 are both greater than the acceptable significance level of 0.05
leading to an acceptance of the null hypothesis that there is no significant
relationship between FDI, DI and GDP.
Go to Homepage to view a list of our well researched, fully supervised and approved Accounting and Banking and Finance Project Topics and Materials.